
Visual and data
Graph and data
Pupils plot points, draw a line, or complete a histogram, pie chart or table of data.
You review itOn paper: a picture you mark
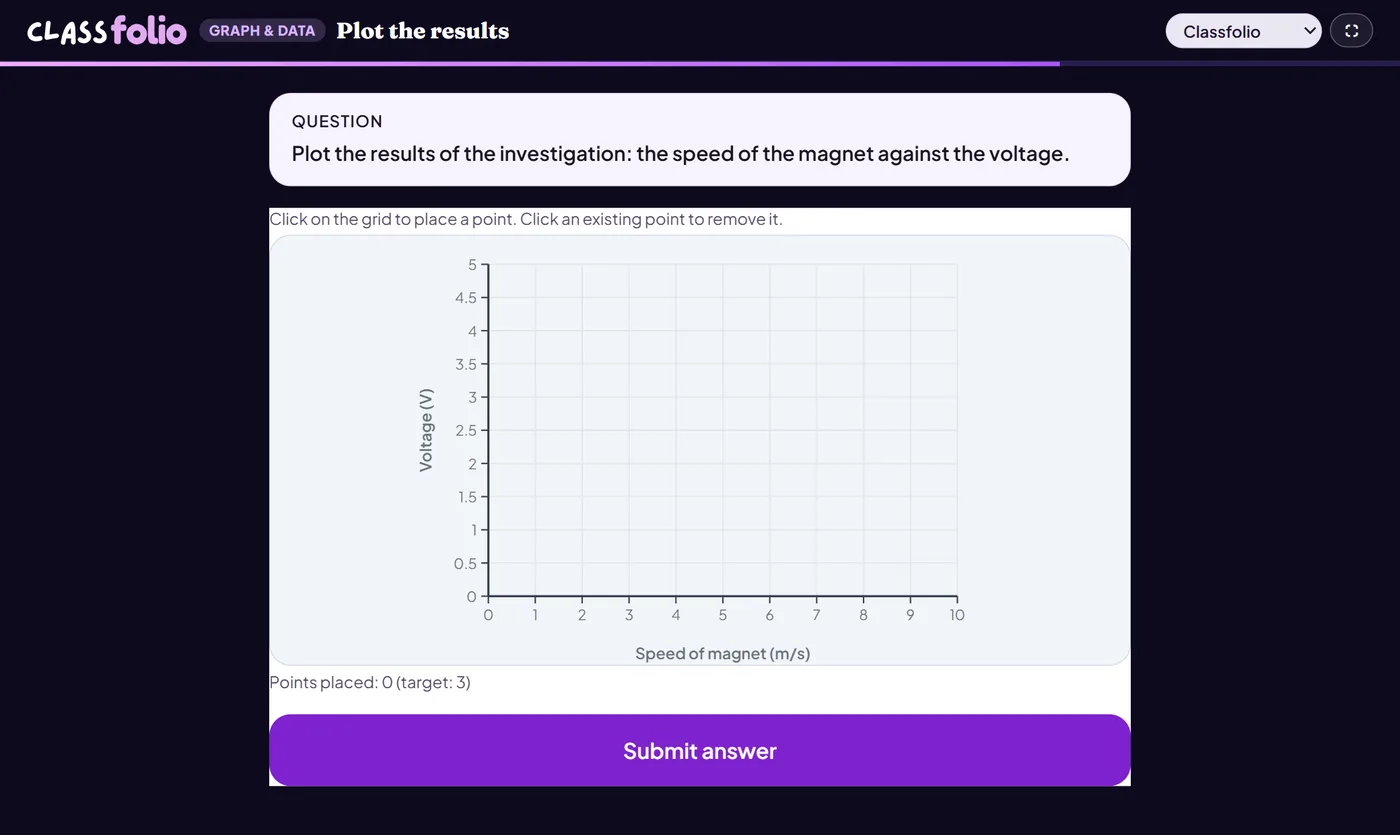
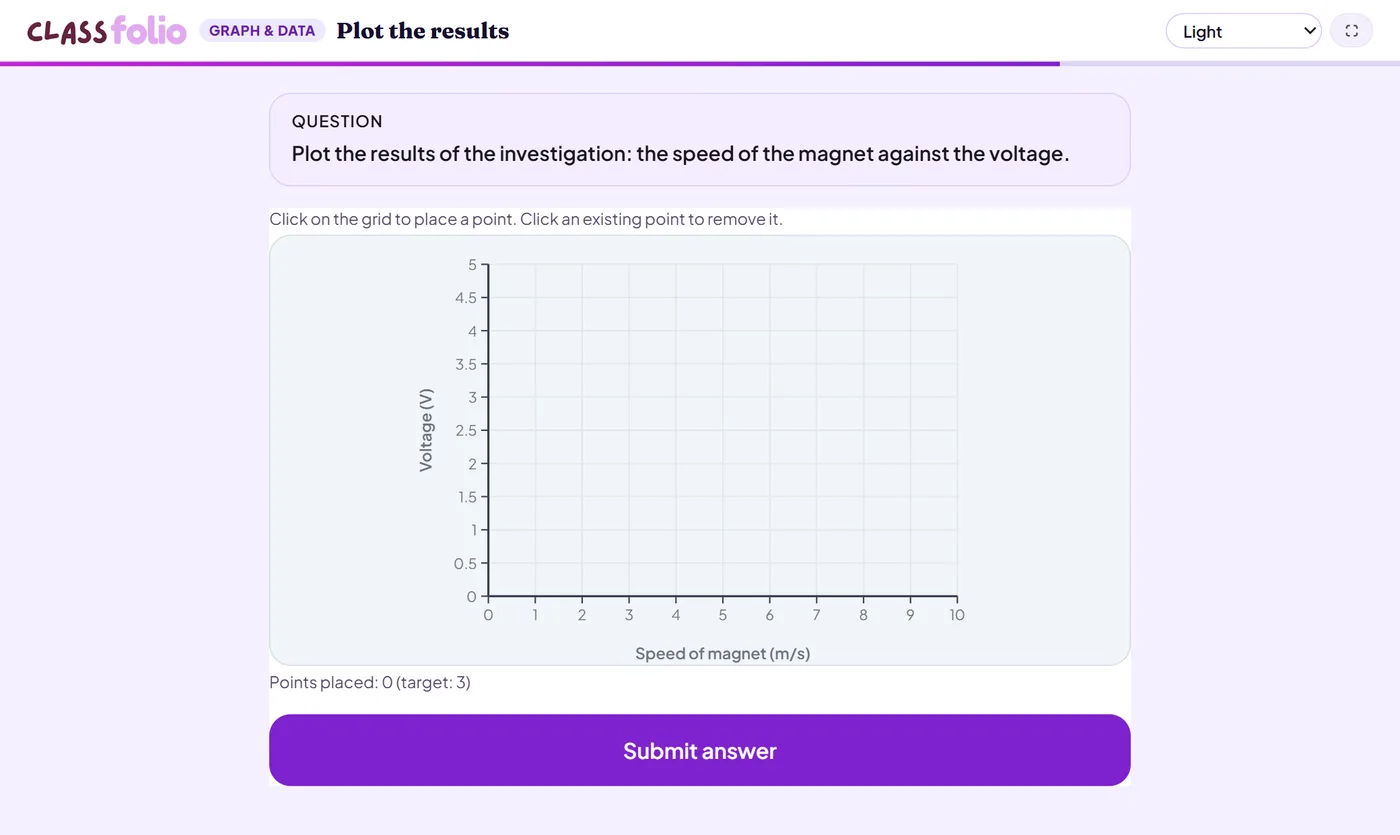
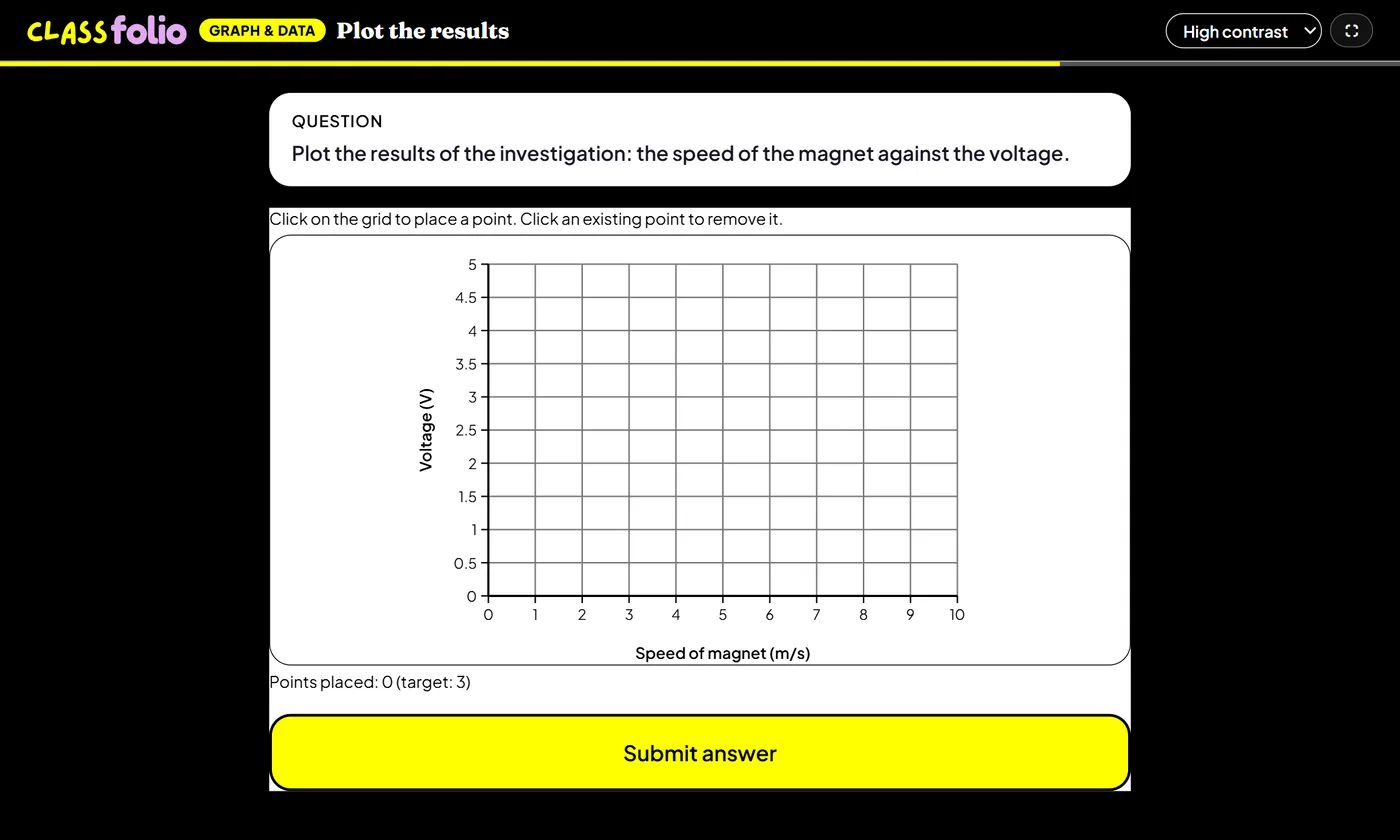
Pupils choose a theme:
Good for
Plotting the results of a practical, or reading values from a graph.
How to set it up
- 1In the lesson editor, choose Add slide and pick Graph and data.
- 2Choose the kind of graph, then set its axes, data or table.
- 3Preview it as a pupil, then run the Readiness check before you launch: it flags anything still missing.
Tips from the classroom
- Give the axes and scale for younger pupils; leave them to choose for older ones.
- On the evidence sheet a graph prints on its own grid.