
Maths, data and drawing
Graph and data
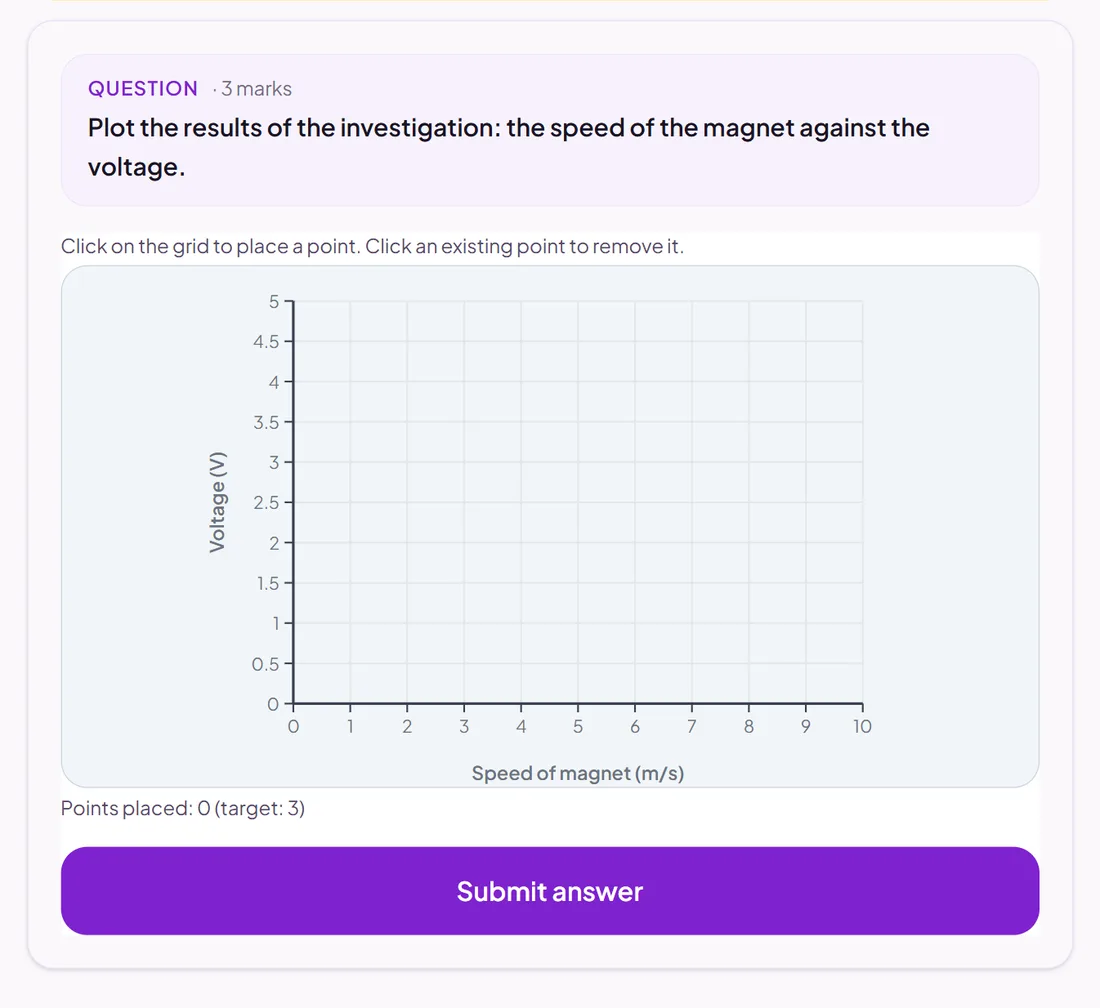
Pupils plot points, draw bars, complete a pie chart or fill in a frequency table.
Marked automatically
Good for
Plotting results in science, and statistics in maths.
How to set it up
- 1Open the assessment in the editor and choose Add question.
- 2Pick Graph and data.
- 3Choose the kind of graph, set the axes, and enter the correct values.
- 4Open Practice Preview to answer it as a pupil would, then run the readiness check before you set it.
Tips from the classroom
- Set a sensible tolerance: half a grid square is usually fair for a plotted point.